Usage
The Usage page shows how much of each harness's quota is left and how many tokens your agents have used.
Open usage##
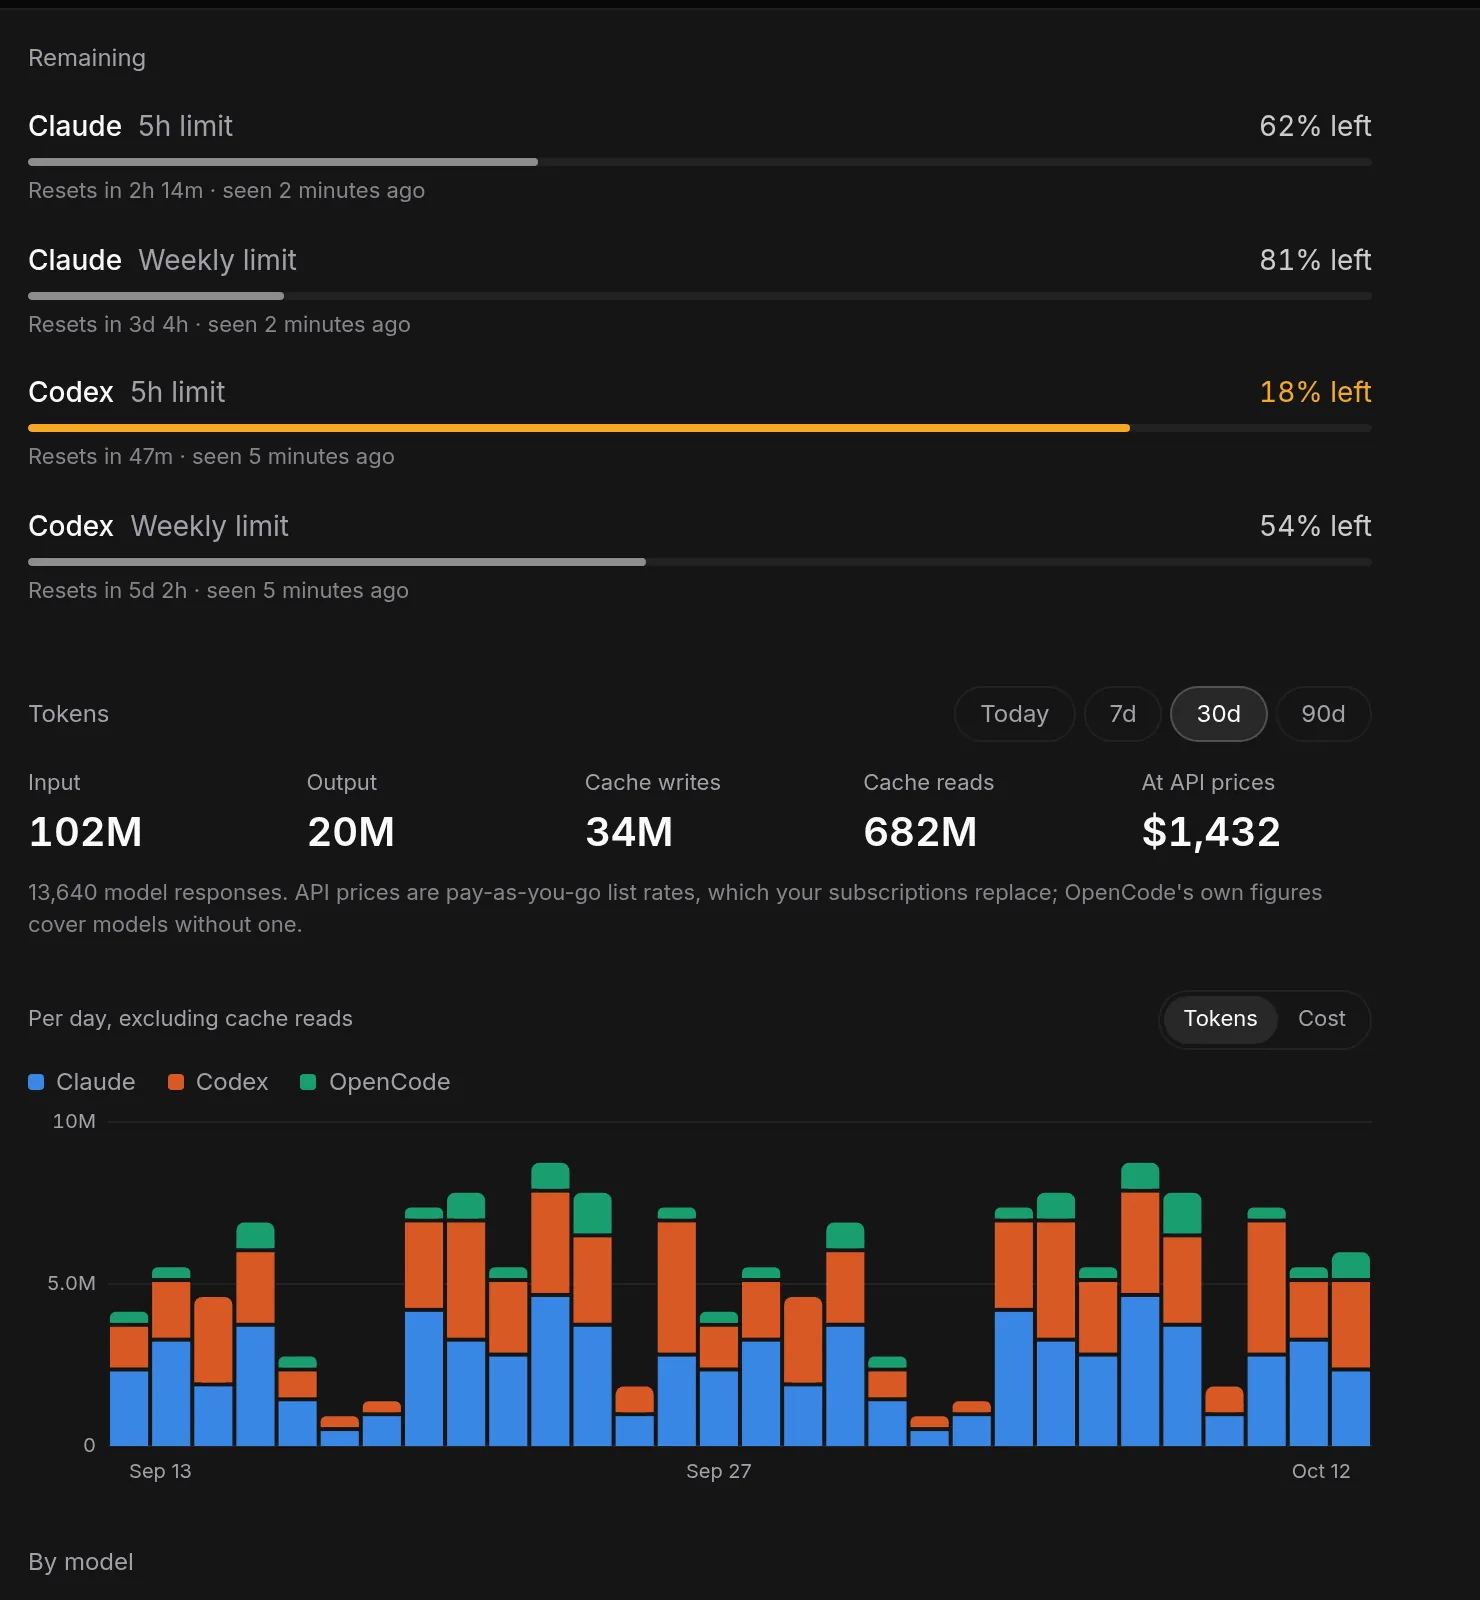
Select the gauge button (Usage) in the top bar, or on the projects page, to see how much your agents are using. It covers every project and every harness.
- Remaining shows each harness's quota windows, with the percentage left and when it resets. Claude Code reports these during Integrated sessions, and Codex records them in its transcripts. Until Patterm has seen one, the section says so.
- Tokens shows input, output, cache writes and cache reads for Today, 7d, 30d or 90d, and what they would cost at pay-as-you-go API prices. A subscription replaces those prices, so treat the figure as a yardstick. The per-day chart switches between Tokens and Cost.
- By model, By project and Skills break the same period down. Skills counts how often each was used, by the agent or by you.
Token figures come from imported conversation history, so turn on a history source first. Tokens from models without a public price are counted but left out of the cost.